Column charts sort the given hierarchies and measures into columns, with the hierarchy's member elements on the x-axis, and the measure on the y-axis. A column chart must contain at least 1 member hierarchy and 1 measure. Member hierarchies can be added to the Categories or Color drop zones, and measures to the values zone.
- On the ribbon, click the Components tab to see Chart Design.
Build a Column Chart
Step 1
Start by adding a member hierarchy to the Categories zone.

Step 2
Add the required measure to the Values zone.

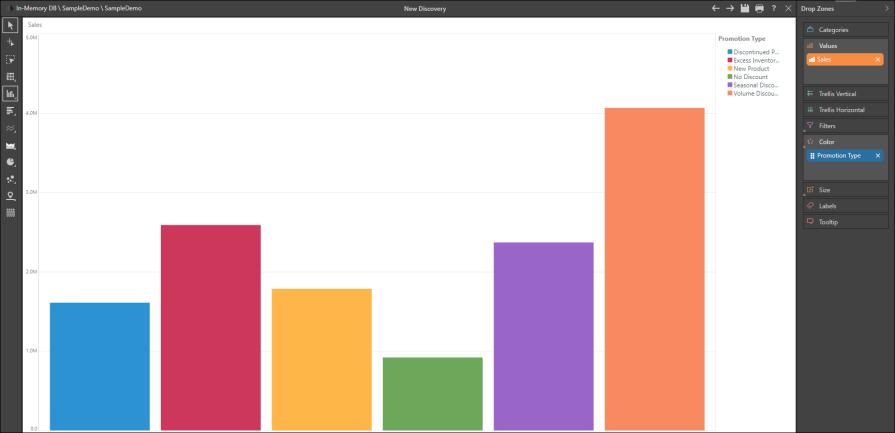
Step 3
Color
If you want to add a color dimension to the chart, move the hierarchy to Color.

Add a Second Hierarchy
Alternatively, add a second hierarchy to Color:

Measure Colors
Another option is to add a measure to Color; this may be the measure in the Values zone, or a different measure.
